

In this guide, we’ll define and showcase the best candlestick patterns for day trading, which you can use to understand price movements better!
These patterns are easy to see and don’t even require a technical analysis indicator.
We’ve done our best to visualize and explain the best candlestick patterns, and we’re confident that you’ll be able to recognize the most common and effective ones by the end of this article.
To get even better alpha in your crypto investing, complement candlestick patterns with other technical indicators.
This gives you a better idea of where the market is going, and we’ll touch on these in the content below as well.
What Are Candlestick Patterns?
Japanese candlestick patterns offer a clear visual representation of the interplay between buying and selling pressure and how it unfolds over time.

They provide useful insights into the fight between bulls and bears in the market and are a valuable tool for anticipating future price moves.
Notice that, unlike technical indicators, which rely on some math formula to work, candlesticks just show how the price is moving over time, being a real-world, direct depiction of the price movement.
However, the meaning and interpretation of the most popular candlestick patterns require knowledge and experience and should always be complemented by additional tools.
The main candlestick formations can be categorized as follows:
- Bullish reversal: this includes patterns like Hammer, Bullish engulfing, Piercing line
- Bearish reversal: signaled by patterns such as Shooting star, Bearish engulfing, Dark cloud cover
- Neutral (Indecision): Candles like Spinning Top or Doji show that the market is evaluating its next move, so either prosecuting the trend or reversing it are possible options.
The Anatomy of a Candlestick
Before analyzing the actual patterns, we need to analyze the anatomy of the individual candlestick because even at this level, we can get bearish or bullish patterns.
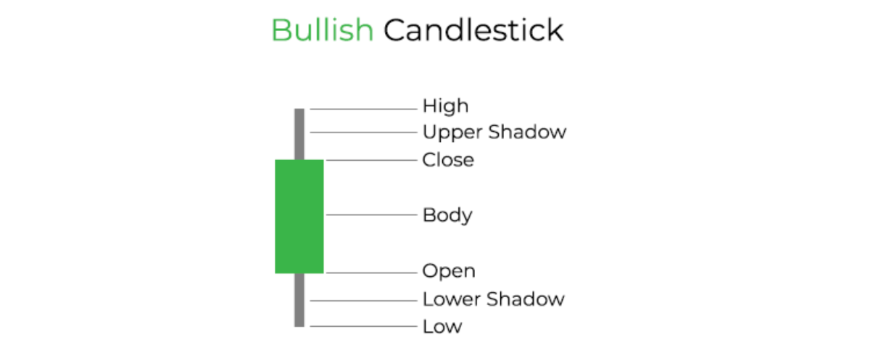
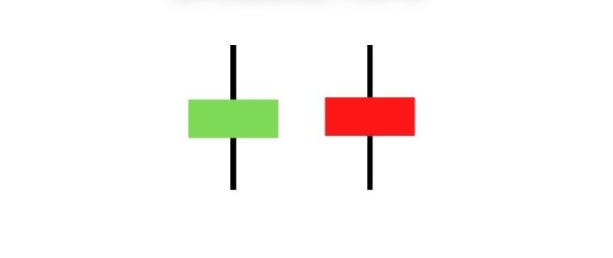
Each candlestick on a chart is like a snapshot that captures the ups and downs of prices during a set period.
The thick part, or the body, shows where the price started and ended, and it’s colored in green or red to show if the closing price is higher or lower compared to the opening price. The thin lines, called wicks or shadows, show the highest and lowest prices during that time.

These candlesticks provide a visual snapshot of the price movement, showing how the traders’ psychology and decisions affect the market trend and behavior.
The 12 Most Effective Candlestick Patterns to Use for Day Trading
We’ve selected only the most popular and effective candlestick chart patterns based on our own extensive trading experience and expertise in the crypto market for over a decade.
You will need them to start understanding this technique, but there are many more to discover later. Sometimes, the same pattern can have a different name or be designed in a slightly different way.
Keep in mind that utilizing candlestick charts with shorter time frames, such as 5-minute or 15-minute intervals, can introduce a higher level of noise and potential false signals.
Conversely, candlestick patterns observed on longer time frames, such as 30-minute or 1-hour, or daily charts, tend to provide more robust signals.
Traders often use multiple time frames to compare them and get confirmation for their short-term strategies. This is useful, especially in day trading scenarios.
Now, let’s take a closer look at the specific patterns themselves.
1. Morning Star
It consists of three candles: the first candle is a long red candle, the second candle, with a small body, represents the morning star, and the third candle is a long green candle that indicates a possible trend reversal.
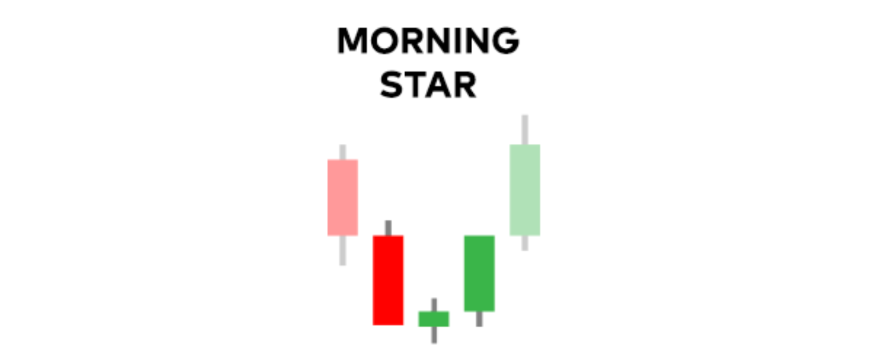
The Morning Star pattern signals a potential bullish reversal during a downtrend. It can be a reliable indicator for potential trend reversal, especially in volatile markets like crypto.
2. Bullish Engulfing
This is a two-candlestick pattern, and it can signal a bullish trend reversal.
To identify such a pattern, you need to look at the candles’ bodies, not the wicks or shadows.
We have a bullish engulfing when a green, bullish candlestick fully envelopes a preceding bearish candle. This means that the body of the green candle has its bottom lower (or equal) than that of the prior candle, while its top is higher than that of the prior candle.
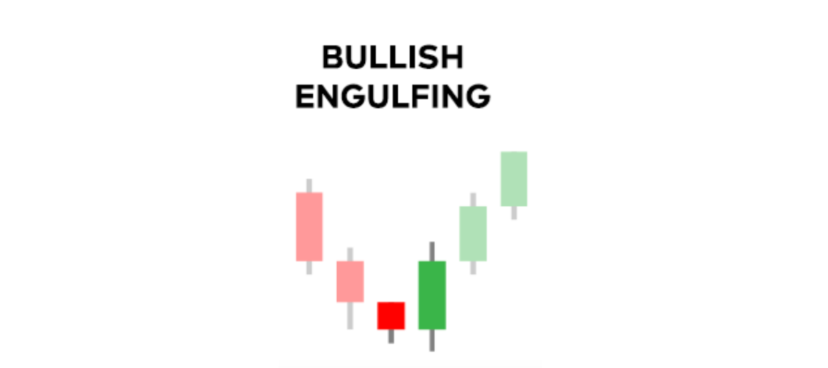
This pattern consists of a tall, green candlestick after a prolonged downward trend, signaling that the bulls are gaining strength. This allows the trader to strategically open a long position when further confirmations appear.
3. Hammer (Hanging man) and Inverted Hammer
The hammer and the inverted hammer are single-candlestick patterns indicating a possible trend reversal.
You can find a hammer (or even an inverted hammer) at the end of a bearish trend, suggesting a trend reversal and an incoming bullish trend.
It is called a hammer because it has a smaller body and a long lower shadow, resembling the shape of an actual hammer. The inverted hammer has the same shape, but it’s upside down.

Another possible setup is a hammer candlestick at the end of an uptrend (in this case, it’s also called “hanging man”), signaling a possible bearish reversal. If the hammer is inverted, you have a similar pattern called Shooting Star (see below).

4. Evening Star
This pattern mirrors the Morning Star but with an opposite market condition.
The evening star, a short-body candlestick, appearing after an uptrend serves as an indicator for a potential bullish reversal, especially when a long red candle follows it.
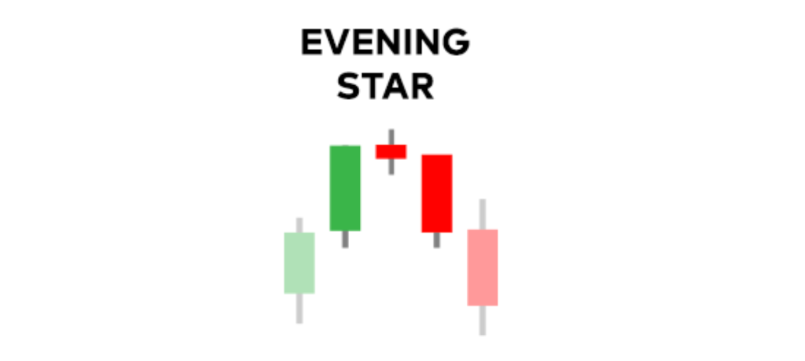
This signifies a trend reversal, with the bears taking control of the market. The trader can strategically open a short position, after checking if market conditions and indicators confirm this trend-reversal scenario.
5. Bearish Engulfing
The bearish engulfing pattern is exactly the opposite of the bullish engulfing; in this case, we have a bearish candlestick pattern.
It is also a two-candlestick pattern, but here we have a bearish, red candlestick that fully envelopes a preceding bullish candle.
In this case, the body of the red candle has a lower bottom than the one of the prior one, and its top is higher (or equal) than the one of the prior one.

This candlestick pattern shows that the bullish trend is losing steam, with a possible trend reversal.
If further indicators confirm the movement, the trader can open a short position, placing a safety stop loss at the top of the pattern.
6. Shooting Star
This is a single-candlestick pattern, characterized by a small body, red candlestick, with a long upper shadow, appearing after a bullish trend. It mirrors the hammer, being the same candlestick pattern, but upside down.
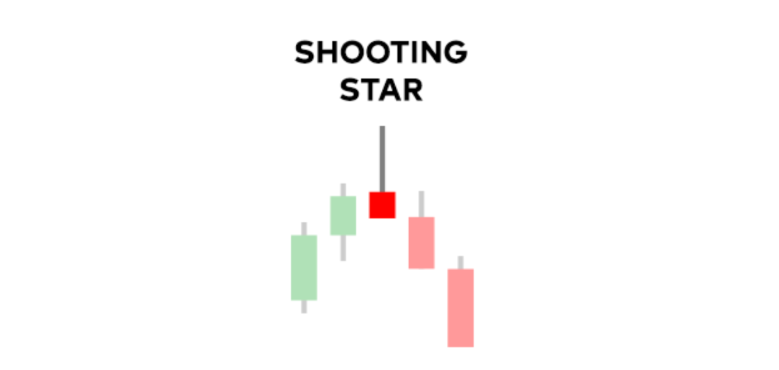
This candlestick, after an uptrend, typically signals a possible trend reversal.
Among all the candlestick patterns, this is probably the most reliable, clearly indicating a shift in the market conditions and an incoming downtrend.
It shows how the price tried to move up (long upper shadow) but then the candle closed lower than its opening price, demonstrating how the bullish impulse failed to succeed.
7. Piercing Line
The piercing line is a two-candlestick pattern characterized by a long bearish candlestick followed by a long bullish candlestick, which closes above the midpoint of the former.
This pattern is similar to the bullish engulfing pattern, but it’s somehow weaker, as the green candlestick is not completely enveloping the previous red one.
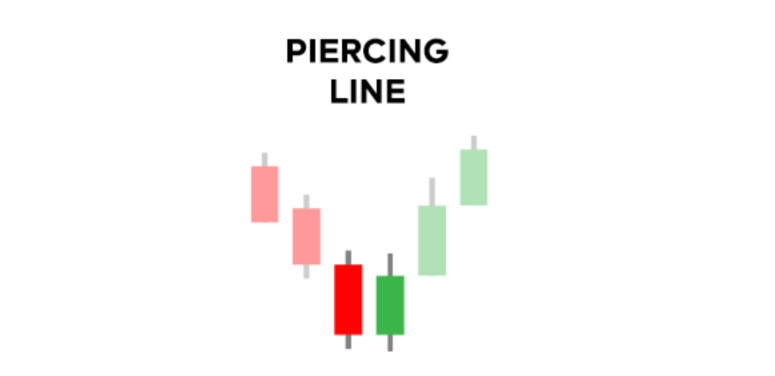
After waiting for the pattern to be fully confirmed (bullish candlestick has been closed, and other indicators confirm the trend reversal), the trader can open a long position, placing a protective stop at the bottom of the pattern.
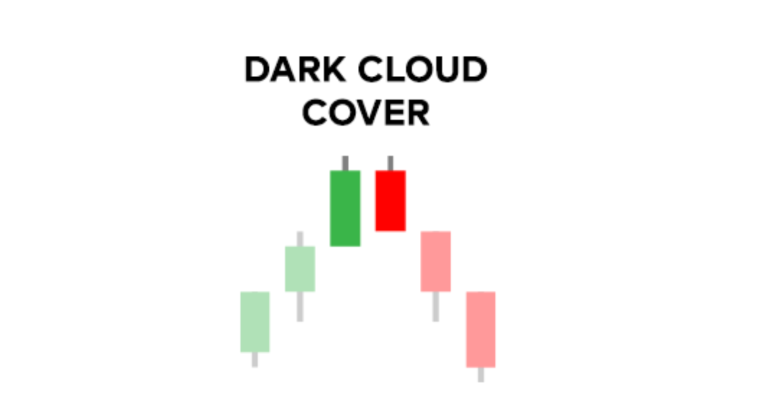
8. Dark Cloud Cover
The dark cloud cover is the opposite of the piercing line candlestick pattern.
The pattern consists of a bullish candle followed by a bearish candle that closes below its midpoint.
Also, in this scenario, the pattern is similar to bearish engulfing, but somehow weaker, as the red candlestick doesn’t fully envelop the previous green one.
9. Doji
The doji, a single-candlestick pattern, with its cross-like form, represents the moment of equilibrium where the forces of supply and demand are in perfect balance. It’s very common to spot a doji every time the market is taking a break, before a trend continuation or a trend reversal.
This pattern, which occurs when the opening and closing prices are nearly identical, also has a long upper and lower shadow.
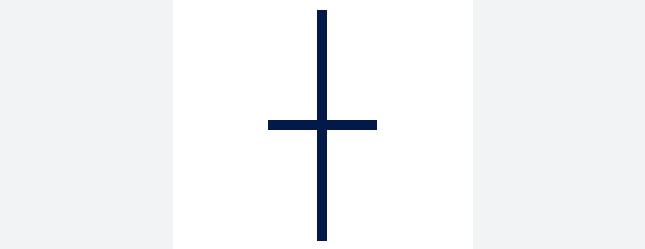
The doji represents a moment of calm, suggesting that the current trend could be losing steam and a change in direction might be preparing.
But beware, as this candlestick pattern may also indicate a prosecution of the existing trend, after a short period of indecision.
Look for volume, support and resistance, and other indicators to get a clearer picture of the incoming price movement.
10. Spinning Top
The spinning top candlestick is the market’s way of expressing hesitation. It is quite similar to the doji, and it only has a slightly taller body, compared to it, so the opening and closing prices don’t really match exactly.
With its small body between long upper and lower shadows, it reveals a moment where neither the bulls nor the bears have taken control of the market.
This pattern often precedes a pause in the prevailing trend or signals a potential reversal, calling for traders to be vigilant and look for further signals and incoming trends.
11. Three White Soldiers
The three white soldiers pattern consists of three consecutive, long green candles, each closing at a higher price than the previous one, indicating an incoming buying pressure, after a downtrend.
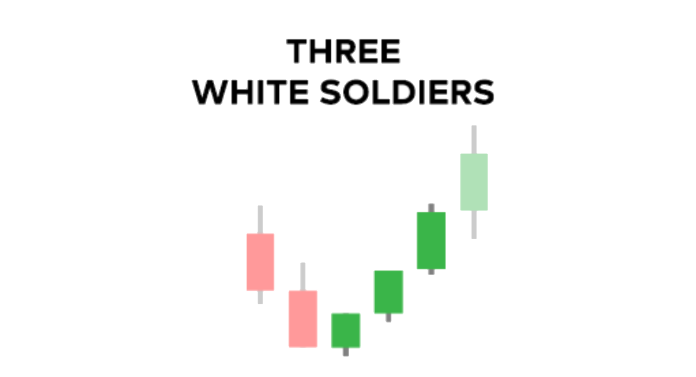
This pattern anticipates a bullish reversal, after a downtrend, as the three candles suggest that the bullish market is taking strength and could reverse the previous bearish movement.
It is advised to wait until the last of the three candles is successfully closed. Also, as usual, traders need to seek confirmation of the trend reversal, looking at the volume and other technical indicators.
12. Three Black Crows
Conversely, the three black crows pattern consists of three long red candles in a row, signaling a shift in the market, with the bears taking control of the price.
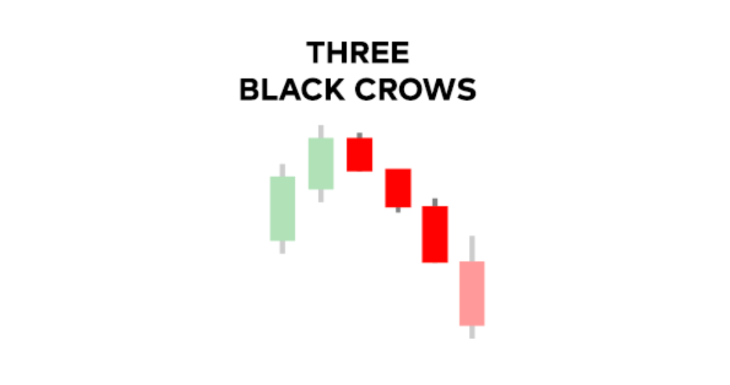
This pattern points to a possible continuation of a downtrend, offering traders a clear signal to align with the prevailing bearish sentiment.
How to Trade Using These Candlestick Patterns
Candlestick charts offer a visual narrative of price action, but experienced traders know that these patterns act as guides and should always be complemented by further tools and observations.
Let’s explore how traders can use these patterns to implement a successful day trading strategy.
Identifying Patterns
The ability to correctly identify candlestick patterns just requires some practice. Beginners can use a cheat sheet like the one we provided in the beginning of this guide, but there are also indicators available. Here’s a TradingView tutorial to automatically identify candlestick patterns.
To better identify and understand bullish or bearish candlestick patterns, it is useful to focus on a single market, such as a specific crypto pair on a designated crypto exchange.
For example, a crypto trader may choose the BTC/USDT pair on Binance and practice there most of the time. This way, he can figure out how the candlestick patterns work in that specific scenario and what to expect in terms of price movement.
Confirming Patterns with Additional Indicators
However, even the most distinct patterns necessitate validation.
For an effective strategy, it’s important to use candlestick charts together with support and resistance levels and various technical indicators. This combination of tools provides a more complete analysis of the market, improving the likelihood of successful trades.
Setting Entry Points, Stop Losses, and Exit Strategies
Traders need to set their strategy once a candlestick pattern is recognized and confirmed.
This includes choosing the right time to enter the market, deciding where to set a stop loss to minimize potential losses, and planning an exit point to secure profits.
For example, spotting a Hammer pattern might suggest it’s a good time to buy, and setting a stop loss can help lock in profits as prices rise.
The Market Psychology Behind Candlesticks

Candlestick patterns serve as a visual shorthand for trader sentiment, capturing the balance of optimism, hesitation, and caution in the market. They provide insights that can guide trading decisions.
Trading Psychology: Emotional Control and Discipline
Traders often make quick decisions based on their emotions, and candlestick patterns can capture these emotional responses in the price movement.
Sudden news or unexpected shifts in price can provoke a collective reaction from traders.
Understanding the psychological aspects at play is fundamental when trading in the markets, and emotional control is essential.
Real-World Examples of Candlestick Patterns in Action
Transitioning from theory to practice, let’s analyze a real-world application of these candlestick patterns.
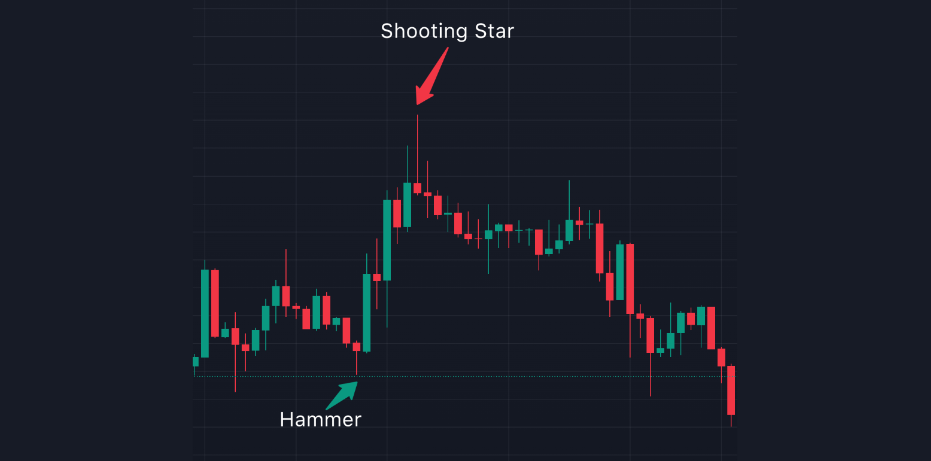
The above chart shows the THETA/USDT pair on Binance, captured with a 4-hour candlestick interval.
Two popular chart patterns are found here, a hammer candlestick (green arrow), announcing a bullish inversion, and a shooting star candlestick (red arrow), successfully signaling a bearish inversion.
It’s interesting to observe that, in this chart, the hammer candlestick doesn’t appear in the expected green.
These patterns should be interpreted in a flexible way, as real-life markets may offer slightly different patterns than the classic ones.
The History of Japanese Candlesticks

As you may notice, the most popular candlestick patterns often have poetic names, and sometimes they are in Japanese. This happens because the study of such candle formations dates back to 18th-century Japan, where rice traders used them.
These early traders, who created the Japanese candlestick charting techniques we are still using today, were able to recognize and study these specific patterns for the first time.
FAQs
For day trading, it's best to use 5-minute, 15-minute, 30-minute, up to 1-hour candlestick time frames to manage risk and identify trends effectively. Pick the time frame that resonates most with you and dedicate time to mastering it until you feel confident in your trading abilities.
Yes, day traders use candlestick patterns to identify entry points for trades and to predict market reversals. Taking the time to assess how these patterns work over time can be helpful in day trading.
This is quite a controversial issue, depending on different studies and conclusions based on different statistics. However, we believe the shooting star is the strongest pattern.
Candlestick patterns provide valuable insights into market sentiment, but should not be relied upon exclusively for predicting market movements. It's important to use them in conjunction with other technical analysis tools for confirmation.
No, it is not necessary to memorize all candlestick patterns to be a successful trader. Focus on a select few that align with your trading strategy.

Susan Oh
Susan Oh is a leading figure in the integration of AI and blockchain for social good, serving as the CMO for BeOmni by Beyond Imagination and a civic technologist dedicated to creating scalable solutions. She is a board member of the Blockchain Commission For Sustainable Development supported by the UN GA Office of Partnerships, and a member of the Global Sustainability Network, a joint initiative by the Vatican and the Church of England to combat human trafficking. Recognized with the...