Understanding Support Levels in Crypto
In the world of cryptocurrencies, a support level refers to a price point at which the decline in the price of a crypto asset halts or slows down due to increased buying pressure from traders interested in purchasing the asset at that specific price.
Support levels can exist both in the short term and the long term, and they are influenced by various factors, including market sentiment, overall market conditions (bullish or bearish), and daily news events.
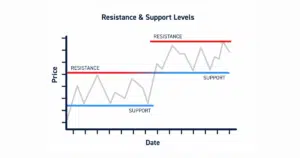
Resistance & Support Levels | Source: Centerpoint Securities
From a technical analysis perspective, a support level is often represented by drawing a line along the lowest lows of the asset’s price within a specific time frame.
Depending on the analyst’s interpretation, the line can be horizontal or sloping.
Advanced models of support levels may incorporate moving averages, Bollinger bands, and other technical indicators.
Utilizing Support Levels in Crypto
Support and resistance levels play a crucial role in technical analysis for crypto traders.
Technical traders rely on support levels to identify suitable trade entry or exit points and effectively manage risk.
Support levels can be used to set stop-loss or take-profit orders.
Unlocking Market Dynamics
It’s important to note that support levels are not always linear or defined by a single price point.
They can also be represented by moving averages, especially in a downtrend.
Traders analyze various support levels to identify key levels at which institutional investors or “smart money” may enter the market with significant liquidity.
Conversely, if a support level is broken, it can indicate the beginning of a new trend, potentially flipping the market sentiment from bullish to bearish.
Trading with Support Levels in Crypto
To formulate a profitable trading strategy, traders need to identify support levels.
There are several approaches to accomplish this:
- Previous Highs and Lows: Traders can consider previous price highs and lows to determine support levels.
- Moving Averages: Traders can utilize moving average indicators to identify short-term and long-term support levels. The 200-day moving average is popular among traders analyzing daily or weekly time frames, but different moving averages can be used based on interpretation.
- Trendlines: Trendlines can also serve as support levels, representing linear price levels within a trend.
Once support levels are identified, traders can determine optimal entry points. Support levels often enter long positions, expecting the level to hold.
Traders may also choose to close short positions, take profits, or cut losses on existing positions.
The specific strategy depends on whether the support level holds or breaks.
Mastering Market Entry
Traders can set entry orders directly at a support level, although some prefer to wait for confirmation of support before entering a long position or closing a short position.
Confirmation, a bounce, helps traders enter positions that maximize profitability.
While price levels are helpful, they are not the sole aspect of technical analysis.
Traders also consider fundamental asset valuation changes and incorporate other technical indicators into their analysis.
Additionally, interpreting support levels (and resistance levels) often involves some degree of subjectivity, with traders holding differing opinions on these levels.