Understanding Candlesticks
A candlestick chart is a graphical method used to display the prices of an asset, including its open, high, low, and close values, over a specified period of time.
The origin of candlestick charts can be traced back to Japanese rice traders in the 18th century, and they remain one of the most popular tools for analyzing financial markets.
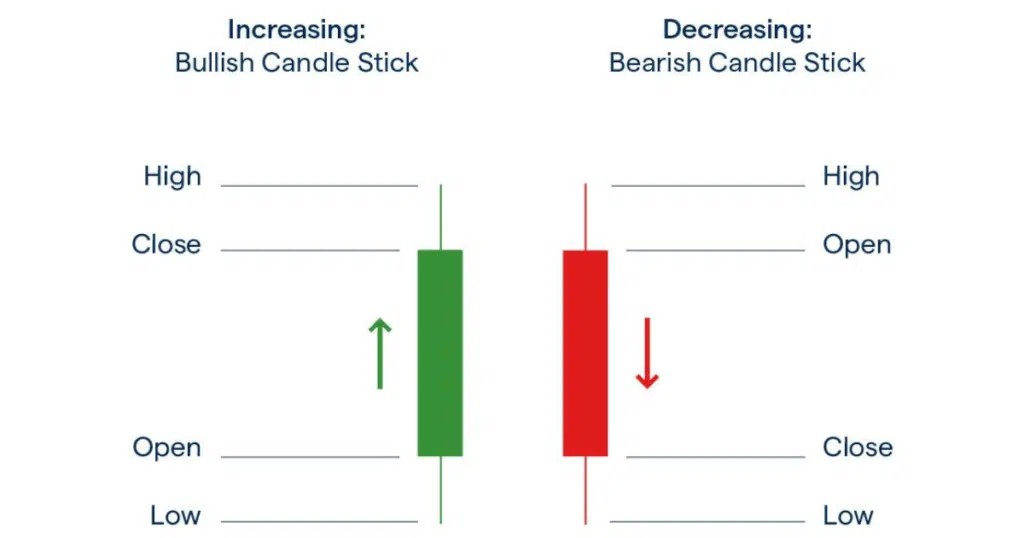
The distinction between a “bull” candle (green) and a “bear” candle (red) is essential.
A bullish candle occurs when the closing price exceeds the opening price, while a bearish candle indicates the opposite.
Candlestick charts provide a concise summary of price movements during the specified period.
Traders can adjust the duration of the candlestick chart, ranging from one-minute intervals to weekly or monthly intervals.
This flexibility lets traders quickly assess market sentiment using color-coded candles and gain valuable insights into price behavior.
The choice of colors used in candlestick charts is customizable, with most charting platforms defaulting to green/red or white/black.
Key Takeaways:
- A candlestick chart provides a visual representation of the historical prices of an asset, such as a cryptocurrency, offering insights into price behavior.
- Candlestick patterns are highly relevant in Bitcoin and cryptocurrency trading, indicating bullish or bearish reversals.
- Candlestick patterns are considered “leading” indicators, allowing traders to anticipate trends and take action before others.
How Traders Utilize Candlesticks
Candlestick patterns are essential for interpreting the movement of an asset within a given period. By observing these patterns, traders can identify bullish or bearish sentiments.
In Bitcoin and cryptocurrency trading, candlestick charting holds significant relevance.
By understanding how candlestick patterns indicate bullish or bearish reversals, traders can proactively respond to these leading indicators before others join the trend.
Since candlesticks rely on raw price data and update immediately after a period is completed, they are considered “leading” indicators rather than “lagging” indicators.
This makes recognizing candlestick patterns a valuable tool in a trader’s arsenal.