What Is MACD Indicator?
The MACD is a trend-following momentum indicator that helps traders find entry points by comparing two moving averages. It’s a Moving Average Convergence Divergence oscillator that was invented by Gerald Appel (MACD) in the late 1970s, which can be especially versatile for crypto.
As a lagging oscillator, the MACD is often combined with more indicators to filter out false signals: the relative strength index (RSI), volume history, or trendlines.
The Basics of the MACD Indicator Explained
The MACD definition involves two exponential moving averages (EMA) calculated from the asset price. Unlike simple moving averages (SMAs), EMAs are weighted formulas where recent periods are more impactful than the older ones.
A “slow” EMA (black line) subtracted from a “fast” EMA (red line) results in the MACD (blue line)— usually 26 and 12 periods, respectively.
The second component of the MACD indicator is the signal line (orange). This is a 9-period EMA calculated from the MACD line itself.
The slow and fast EMAs may appear in the price chart and are only for calculations. In the indicator chart below there are three components used for technical analysis: the MACD, signal line, and histogram (which visually shows the difference between both).
Both the MACD and signal are neutral at 0 (the zero line), ranging between positive and negative values.
To identify potential entry points, traders compare the MACD interaction with the zero line and signals line.
MACD Calculation Formula
The MACD formula starts with the calculation of the fast and slow EMAs.
For example, in a 10-period EMA, the first period is worth 18.18%, and the 10th one is worth about 3%.
EMA = {2 / (time periods + 1)}
After adjusting all values with their multipliers, the 10-period-EMA is the sum and division of all time periods (in this case, the sum of all 10 divided by 10).
The same calculations can be used to find the 12 and 26-day EMA. Once calculated, the MACD formula is:
MACD = 12-day EMA – 26-day EMA3
“If the moving average convergence/divergence (MACD) is essential to your analysis, then an indicator that often leads it at critical situations will be of great interest to you”
Giorgos E. Siligardos, PhD.
What Are MACD Pattern Signals?
MACD pattern signals occur whenever this line crosses either the zero or signal line. These create potential entry points depending on their positioning.
Key MACD Indicators
The key indicators are the MACD and signal line, which traders compare to identify patterns, mainly crossovers and divergences:
Crossover
The MACD is the primary (blue) line that’s compared with the zero and signal lines to find crossover signals.
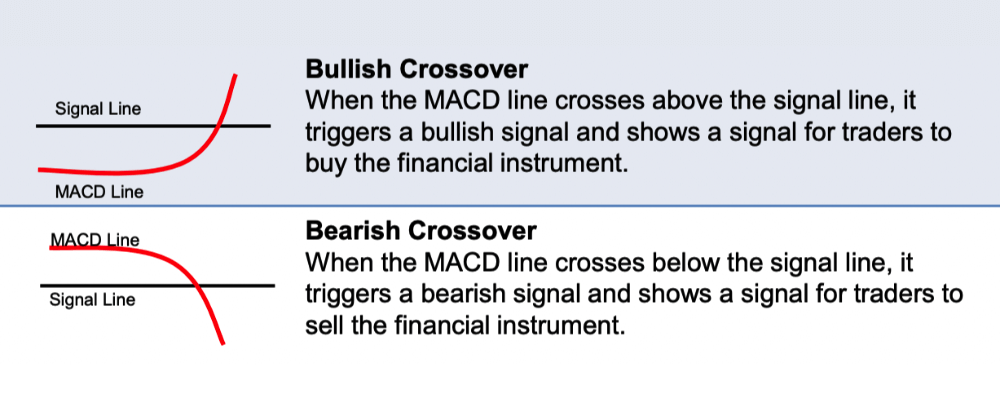
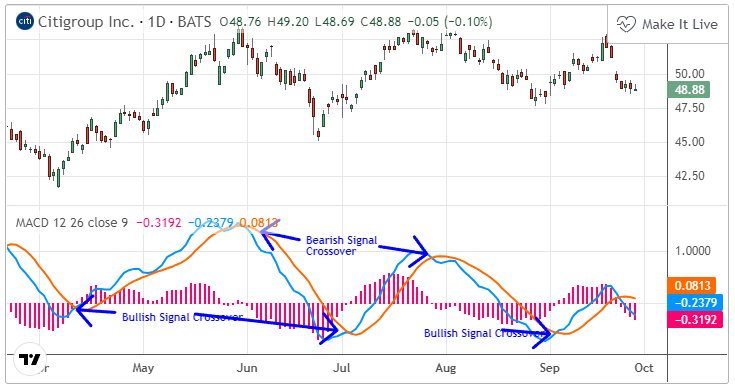
- When the MACD crosses the signal line from below to above, it’s bullish. Crosses below the zero line are stronger signals.
- When the MACD crosses it from above to below, it’s bearish. Crosses above the zero line are stronger signals.
Below are both examples:
It can also indicate entry points when crossing the zero line from above to below (bearish) and vice versa (bullish), especially when preceded by a matching signal line crossover:
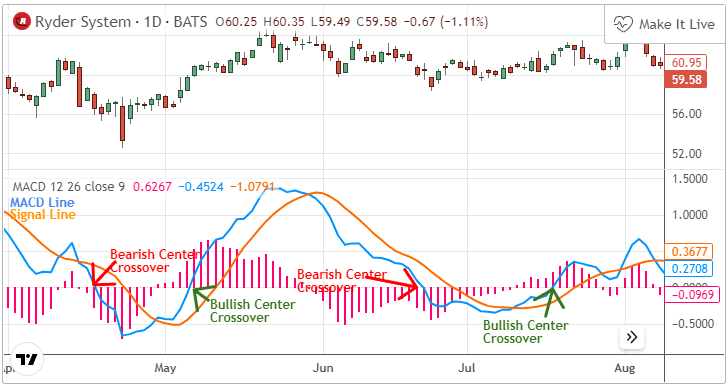
However, signal line crossovers near the zero line can occur multiple times, creating misleading signals. It’s better to either add more indicators, wait to separate from the zero line and compare divergence patterns.
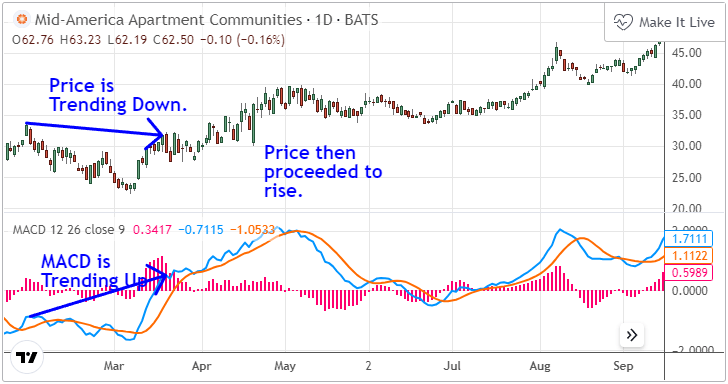
Divergence
Before a MACD crossover, the price and indicator move in different directions called divergences. Depending on the alignment, traders can anticipate trend changes, price reversals, or continuations:

- Lower/equal price lows and higher/equal MACD highs will signal a bullish reversal, whereas the opposite movement (hidden) points to trend continuation.
- Higher/equal price highs and lower/equal MACD highs will signal a bearish reversal, whereas the opposite movement (hidden) points to trend continuation.
Below is a bullish MACD divergence example:
Below is a bearish divergence example:

Since crossovers are somewhat infrequent and inaccurate, traders often wait for divergences to match their signals.
Dramatic Rise
In a “dramatic rise,” the signal line sharply rises above the MACD and zero line. It indicates that the asset could be overbought and soon return to normal levels. To avoid false signals, traders will also look to confirm this with an RSI over 70.
The opposite case is a sharp decline below the MACD and zero line, along with an RSI below 30, likely followed by a fast price recovery.
Using MACD Indicator in Cryptocurrency Trading
The MACD is one of the best indicators for identifying momentum reversals. Below are the differences to adjust for cryptocurrency trading:
- Longer timeframes: Cryptocurrencies move quicker, which is why it’s not recommended to use shorter than hourly periods. 26 and 12-day periods will avoid most fake signals.
- Active trading volume: MACD is ineffective for ranging markets and sideways trends. Traders should look for increasing volume history, verify trend strength with more indicators, and ideally trade larger altcoins.
- Far distance from zero: Due to crypto volatility, zero-line convergences will likely lead to back-and-forth crossovers, with the exception of large MACD swings. For better results, traders watch the histogram to ensure enough crossover distance from zero.
Sources:
Siligardos, G. (2024, May 10). Leader of the MACD. S&C. https://c.mql5.com/forextsd/forum/93/leader_of_the_macd.pdf