

TL;DR
TradingView is a technical analysis software that allows trading professionals to customize technical indicators for financial assets.
To start using TradingView:
- Log in to TradingView with your TradingView account.
- Open a chart.
- Click on Trading Panel at the bottom.
Once registered, you need scripts for technical guidance, strategy, and trader experiences. Let us go over them in detail.
How to use TradingView in 2024
TradingView is an excellent technical analysis software that allows traders to customize technical indicators. It provides easy access to chart design for analyzing financial assets. These indicators are a public library that other traders use daily as patterns.
However, many ask themselves how to use TradingView in 2024. What are the advantages and disadvantages? Is access to TradingView free or not? These are all questions that need to be answered.
In this context, we provide a complete guide to answer all your questions about TradingView.
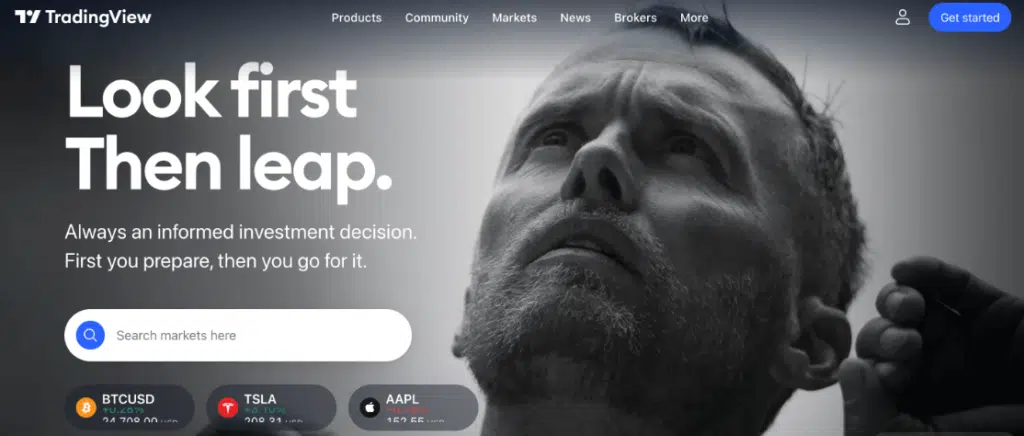
First off, create an account by clicking [Get started].

More details
TradingView is a top-tier financial platform for savvy investors and active traders. Immerse yourself in essential data, up-to-the-minute news, and an engaging social network tailored for market specialists. Seamless compatibility with a plethora of markets, diverse asset types, and popular brokerage platforms, TradingView stands unparalleled.
-

User-friendly charting capabilities.
-
Cross-platform availability.
-
Extensive market and asset class support.
-
Impressive library of built-in indicators.
-
Robust social networking features.

-

Restricted broker compatibility.
-
Overwhelming content on social networks.
-
Inadequate screening capabilities.

What is TradingView, and who is it for?
TradingView is a platform designed to help people who want to one day become experts in the art of making money through trading. You will need a whole arsenal of strategy testing, training, and experience on the trading charts to achieve this.
For this reason, you will have to resort to a wide range of coaching, setting up rubrics on the psychology of traders.
What makes the Tradingview platform unique is that these ideas are well coordinated educationally, so they are not market-based on an academic textbook or guidebook with expensive course accessibility.
However, there are social networks with experienced traders in an environment where you can ask questions freely.
It is then a world where you can share your findings, strategies, and methods to help beginners on the charts in TradingView.
How to benefit from TradingView and its advantages on Bybit?
The exchange we recommend you start learning on is Bybit. Bybit is an excellent chart platform for cryptocurrency.


More details
Bybit is a leading futures trading platform globally, offering up to 100x leverage and attracting users who prefer to remain anonymous. With a presence in 180+ countries, it is renowned for its efficiency and unique features in cryptocurrency derivatives trading.
-
The platform offers up to 100x leverage trading.
-
Strong educational resources.
-
Diverse markets for traders, spot, perp, and futures.
-
Risk-free demo accounts to explore all key features.
-
TradingView integration.
-
The platform is difficult for beginners to navigate.
-
It does not offer a quality spot trading feature.
-
The NFT marketplace is limited in terms of options.
-
Security is of the gold industry standard.
It is positioned well in the market thanks to its offers of various products based on digital currency. It provides users with services that meet the reality of everyday life.
Before being able to trade on the platform, you must register on the platform. Once you have done this, you will receive a welcome bonus and can start trading.
If you still don’t have an account, check out our step-by-step guide on creating an account here.
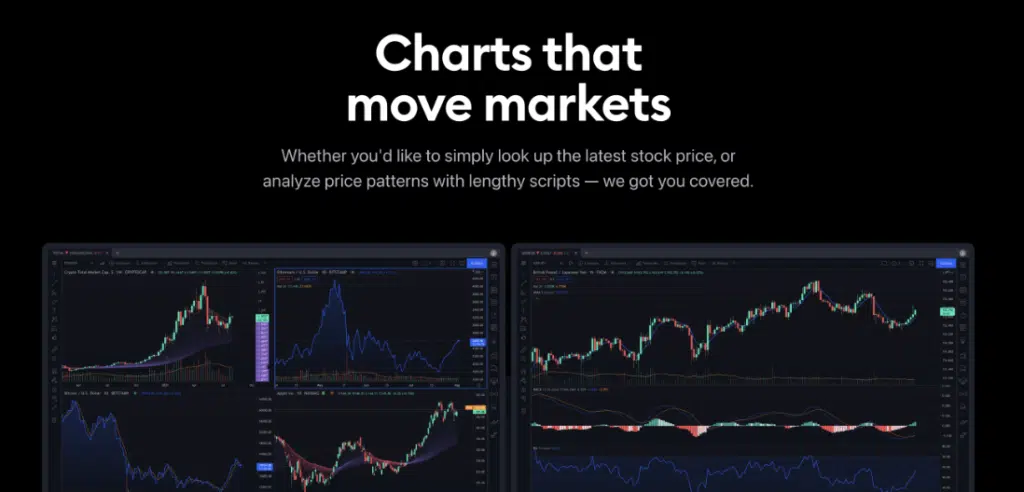
What makes TradingView a great charting tool?
TradingView is a platform that offers top tools that track market movements. Firstly, you must use a pine script to analyze or act based on the latest price patterns.
Then, analyze the techniques correctly, watch out for the unmistakable alerts, test your trading strategies, go your Pine Script, the trader programming language, and finally, have the complete financial analysis, whether it is a high-tech or low-tech tool on a chart.
What are the best indicators in TradingView?
Let’s look at some of the top indicators TradingView has to offer that every trader should know.
1. Bjorgum superscript
Bjorgum superscript is an excellent trend indicator that stands out because it is based on the Tilson moving averages. This allows it to identify trend changes on the chart quickly.
Trend change signal indicated by a yellow color change, which signals the close and announces the Tilson crossbar.
On the other hand, blue and red signal confirmation when two moving averages cross. The reverse trend is ideal for Tilson.

2. Pi Cycle Bitcoin High/Low
Bitcoin’s high Pi cycle is a new trend indicator trading view.
The result of research has been done to develop a chart indicator for brokers. Pi Cycle is also based on features. It has a top signal stock draws a Bull Run top from the chart. This signal was seen twice in 2013, 2017, and 2021.
For this fact, macro TA analysis predicts it will likely see a second one in the coming years. There is a combination of both upper and lower indicators on the charts. This shows that the MA converges towards the feature of good indicators that will cross in the future of the charts.

3. Rolando Santos True Relative Movement (TRM)
This strategy has two leading feature indicators represented by three colors drawn on the chart.
The leading indicator, RSI, is coupled with a lagging indicator, TSI. This produces a color of bars based on the state of each indicator.
Both indicators produce blue bars in positive territory and yellow bars in negative territory on the chart. There are many other trend indicators, but we will mention these.

TradingView: Top Features & Perks
TradingView is a platform that makes life easier for its users thanks to its simple and accessible features. The first thing to know:
Tradingview is the size of a financial market.
Unlike most brokers displaying limited charts, TradingView offers data for over 300 virtual currencies, making it an informative platform with various features.
Strategy for scanning charts to analyze data.
TradingView is vital for peer-to-peer currency trading, with EUR/USD being the most popular pair. Save time by using tools to scan options trading data on your desktop.
Why the Tradingview concept?
TradingView’s features promoting free access and exchange have led to its charting success. Market success requires understanding other users’ mindsets and considering their technical analysis.
What does the chart represent in TradingView?
Once on the trading strategy interface, you can use the charts on the Meta Trader four platforms. Several fun tools are available in the center of the screen, offering ways to customize the charts and letting the trading community know your thoughts.
Best indicators for MP4
Tradingview has been designed to help within a community where it is possible to work together to develop and solve problems on the Meta Mp4 platform. It is a great hub where you can quickly sell trade indicators on the trading view.
This platform allows you to modify and create prices to access MP4 code, enabling you to explain View gain access.
TradingView’s best scripts
Strategy Scripts is a comprehensive trading alert guide that helps traders and brokers determine the entry and exit points in the financial markets. It is a resource packed with over 5,000 stocks strategy-tested trading indicators designed by the TradingView community.
It illustrates examples and time frames with a drop-down menu to become a master of trading support and price action on social networks.
The premium version description
The premium version of tradingView is the charting platform where professional traders and broker can recharge their batteries with alerts without paying. To do this, you need to have a free account created. You also can draw your charts on the tab.
All the tools and documents to help you understand are based on the desktop app.
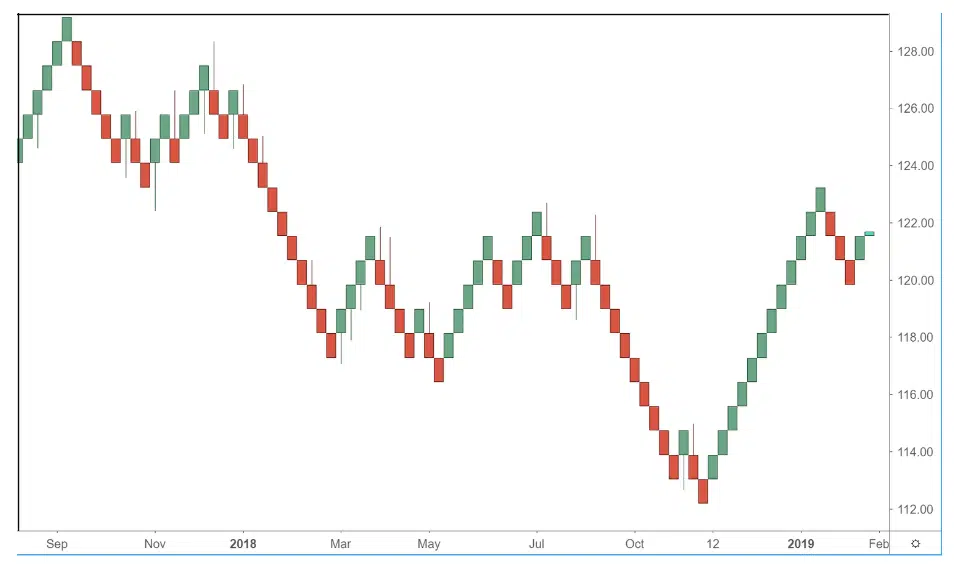
Types of Training View Charts
There are several forms of chart layout. Among these chart layouts, here are some examples:
Firstly, the TradingView comprises Renko charts, which trace the evolution of prices and trends. Renko means brick in Japanese. The formation of the bricks defines the price movements. The different types of Renko charts are:
- Rising bars: This is the bar that forms above the previous brick.
- Downward Bars: This is the bar that forms below the last brick.
- Upward Bars: During an intraday period, a potential upward brick would form based on the current price.
- Downward Bars: During intraday, a potential downward brick would form based on the current price.
How do I get the instruments onto the TradingView charts?
First, your support and residency are the safest indicators to avoid risk. Once you know how support and resistance work, the other instruments are only for experienced people like brokers.
Knowing the features and trends, whether upward or downward.
Indeed, no position on the chart is taken by chance in the market. Analyzing strategies and techniques first is worth analyzing, usually based on support and resistance levels.
This is why it is crucial to master the trading pattern instruments to make retracements and define your favorable advance zones to make enough money.
Summary
Tradingview is the best charting tool in the market to create indicators and the trend line essential for maximum profit, regardless of crypto, forex, stocks, ETFs, and metals.
You get access to the best tools created to figure out what works for your trading strategy. If you are new to TradingView, go to their Tutorials tab to learn how to apply it.
More details
TradingView is a top-tier financial platform for savvy investors and active traders. Immerse yourself in essential data, up-to-the-minute news, and an engaging social network tailored for market specialists. Seamless compatibility with a plethora of markets, diverse asset types, and popular brokerage platforms, TradingView stands unparalleled.
-
User-friendly charting capabilities.
-
Cross-platform availability.
-
Extensive market and asset class support.
-
Impressive library of built-in indicators.
-
Robust social networking features.
-
Restricted broker compatibility.
-
Overwhelming content on social networks.
-
Inadequate screening capabilities.
TradingView excels in providing an easy-to-use platform for novice traders learning about indicators, strategies, and personal style development, while offering exceptional power for experienced traders with custom scripts.
Many brokers on TradingView offer demo accounts for trading. First, create a demo account on the broker's website, then select the broker in the Trading Panel at the bottom of your chart and log in using your broker's demo account credentials.